the Creative Commons Attribution 4.0 License.
the Creative Commons Attribution 4.0 License.
 | 02 Aug 2019
Effect of deep cryogenic treatment on copper electrode for non-traditional electric discharge machining (EDM)
Gurdev Singh Grewal
Dhiraj Parkash Dhiman
In the last few decades, non-traditional machining made the machining process easier than the traditional machining method. Electric discharge machining (EDM) is one of the most prominent methods of non-traditional machining processes. By the use of EDM, a complex profile and high hardness materials can be easily machined, which cannot easily be machined by the traditional machining method. EDM is widely used by the industries. This paper investigates an experiment with the cryogenically treated copper electrode and an ordinary copper electrode with various input parameters like the electrode rotation, gap voltage and discharge current for an EN24 (a high-strength and wear-resistant steel) material. An experiment was performed with electric discharge machining. Designs of an experiment are carried out using the Taguchi approach. An orthogonal L16 array prepared and used the different combination of the three input parameters (current, electrode rotation and gap voltage) to find an optimum value of the factors. The output factors are the overcut (OC), the tool wear rate (TWR) and surface roughness (Ra). The optimal level and importance levels of each of these parameters are obtained statically using an analysis-of-variance (ANOVA) table through the analysis of the S∕N ratio. The study also compares the theoretical and experimental values of the overcut, tool wear rate and surface roughness for traditional and non-traditional EDM. The following research finds optimal or dominating factors (current and rotational speed) for the TWR and Ra in both traditional and non-traditional electric discharge machining; moreover there was a reduction of approximately 9 % in overcut, 13.25 % in the tool wear rate and 15.75 % in surface roughness for the deep cryogenic and non-traditional machining process.


The electrical discharge machining (EDM) is widely used to machine a very hard surface material at a low cost and with fewer hardness tools (Huang et al., 2003). This machining operation was improved and upgraded with time (Habib and Sameh, 2009). In the 1930s, EDM came into existence for the first time for a machining purpose, but due to overheating, lower material removal rate (MRR) and lower quality of the machined surface, it could not be used on a large scale. So to overcome this problem, the researchers worked continuously after the introduction of the EDM to improve the quality of the machining operation, improving surface finish, the material removal rate, etc. In the EDM process, removal of metal takes place due to the erosion carried by the sparks occurring between the tool and work piece (Srivastava and Panday, 2011). At present, EDM is the most widely used technique for high-precision machining of all types of conductive metals, irrespective of hardness. It is also used in the automobile industry, in aerospace and in the farm industry (Shazarel et al., 2009). The initial cost of EDM machining is high, but with the selection of the optimal parameter levels, its wastage and operating cost decrease with quality improvements (Kapoor et al., 2012). The EDM process continuously analysed with different levels of parameters to improve the quality of machining output. In this present research, machine factors like the overcut, TWR and Ra are taken as machining output (response) parameters. So for the better dimensioning and quality, TWR, Ra and overcut size should be at a minimum (B. R. Kumar et al., 2014).
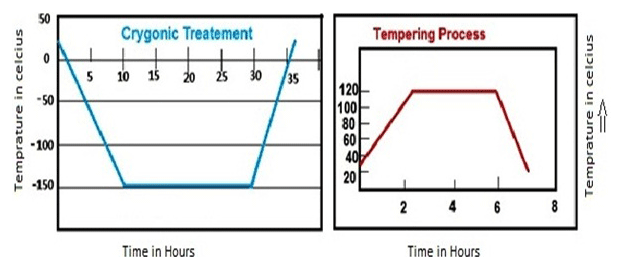
Figure 1Cryogenic treatment and tempering (CTT; Singh and Singh, 2011).
Kumar and M (2014) performed an experiment on a cryogenic cooled electrode and found a more beneficial effect on the machining operation than the conventional electrode. Gill and Singh (2010) investigated the effect of deep cryogenic treatment on the Ti 6246 alloy for a machining purpose. The investigators found a higher material removal rate and lower tool wear rate. Srivastava and Panday (2013) conducted an experiment with the process parameters like the pulse in time, current, duty cycle and voltage for response factors like the tool wear rate, material removal rate and surface roughness with a cryogenically treated electrode. They revealed that the current, pulse in time and duty cycle have a significant effect on the tool wear and material removal rate. In this research paper, the cryogenic treatment of an electrode is examined. Yildiz and Nalbant (2008) made an improvement in tool life by using the cryogenic process in the cutting operation. Abdulkareem et al. (2009) reveal that surface roughness is reduced by using a cryogenically cooled electrode during machining. Kumar and M (2015) carried out an investigation with machining parameters including the pulse in time, gap voltage and current for output responses comprised of the material removal rate, electrode wear rate, and electrode temperature for conventional and cryogenic EDM. The pulse in time has the most significant factor, and moreover, electrode wear was reduced to 18 % by the cryogenic electrode.
2.1 Material details
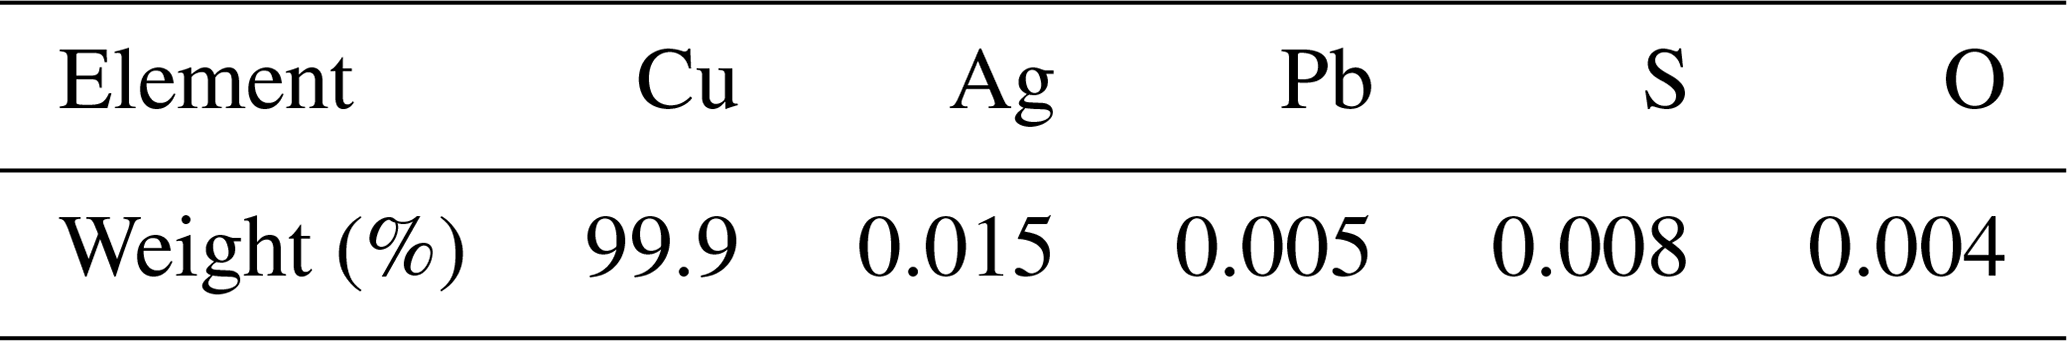
EDM is applicable to electrically conductive materials. In this paper, the research is conducted on a EN24 steel work piece. This material is used for variety of parts, dyes, gears, shafts and moulds. EN24 steel is widely used in power and transmission due to its high tensile strength. In this experiment a 10 mm diameter of the copper electrode is used. The weight of the electrode and work piece was measured with the help of a weighting machine. Moreover thickness and the diameter of the work piece and tool are measured with a digital micrometer.

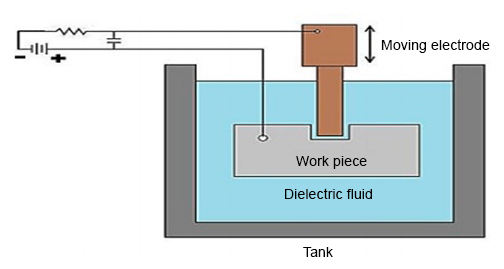
The work piece and electrode were submerged in dielectric fluid, which is shown in Fig. 2. The dielectric fluid is the insulator of electricity. Therefore this insulation property of the dielectric produces a required limit of the potential difference between the tool and work piece that is necessary for spark generation (Zhiguang et al., 2015). The gap difference between the work piece and electrode was maintained with the help of the servo mechanism. This mechanism maintains a gap of about 0.03 mm. In this mechanism, operation length and the diameter of the work piece are respectively 28 and 15 mm. In this machining, the dielectric fluid is kerosene oil (Gill and Singh, 2010). The electrode material used in EDM is the copper electrode, having 100 HB (HB – Brinell hardness unit) hardness and a electrical resistivity of 9 µΩcm. The compositions of work pieces and electrodes are mentioned in Tables 1 and 2. In this experiment, two types of cylindrical copper electrodes are used. Both electrodes are 20 mm in length and have a 10 mm diameter. One electrode is cryogenically treated, and the other is not cryogenically treated. Copper metal has low electrical and thermal resistance. Due to this, it transfers more energy to the work piece.
2.1.1 Mechanism of EDM
The D.C (direct current) supply of a high ampere current at low voltage is given to the electrode. This permits the spark between the electrode and the work piece through the dielectric fluid (Singh and Singh, 2011). This spark generates high heat between the electrode and work piece. This heat is sufficient for eroding or melting the material from the work piece. The molten particles are flushed with the flow of a dielectric fluid. This flow is circulated with the help of a pump. In this experiment both electrodes connected with negative polarity and the work piece in positive polarity, as shown in Fig. 2.
2.2 Design of experiment
2.2.1 Taguchi technique
The Taguchi technique is very helpful for optimizing the results. It is mostly used by manufacturing engineers, scientists and quality-assurance experts. The main target of the Taguchi method is to set up an experiment and to develop superior performances. Classical experimental design methods are too complex and not easy to use. Furthermore, a large number of experiments have to be carried out as the number of the process parameters increases. Instead of testing all possible combinations like the factorial design, the Taguchi method is applied. So to solve this important task, the Taguchi method uses a special design of the orthogonal array to study the entire parameter space with only a small number of experiments. An experimental design scheme of statistical experiments that uses orthogonal arrays, however, entails the following considerations and consequences.
The orthogonal array focusses only on a main effect design. An orthogonal array has been used by researchers for the last few years to determine the minimum number of experiments. The selection of orthogonal array is one of the important sets for performing the experiments to determine the optimum level for each parameter.
2.2.2 Analysis of variance
Analysis of variance (ANOVA) is selected for choosing new parameter values to optimize the performance characteristic at 95 %. The F value is used to check the significance of values. The probability of the F value which exceeds the calculated F value due to the noise is given by the P value. The verification test is used to verify whether this approximation is satisfactory and valid.
2.2.3 Signal-to-noise ratio
The experimental results are then transformed into a signal-to-noise (S∕N) ratio. The S∕N ratio is used to measure the deviation of the performance characteristics from the desired values. The categories of performance characteristics in the analysis of the S∕N ratio depend on output parameters being controlled. The S∕N ratio is used to measure the quality characteristic, such as larger being better, nominal being the best or smaller being better.
The objective of this research is to minimize the tool wear rate, surface roughness and overcut. In this research paper S∕N ratios of the overcut, TWR and Ra for both the cryogenically treated and untreated electrode are “smaller is better”:
where y is responses for the given factor level combination and n is the number of responses in the factor level combination.
2.3 Cryogenic treatment
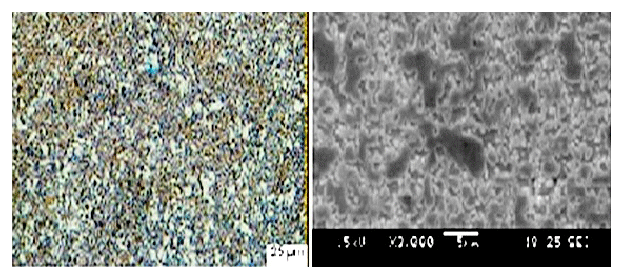
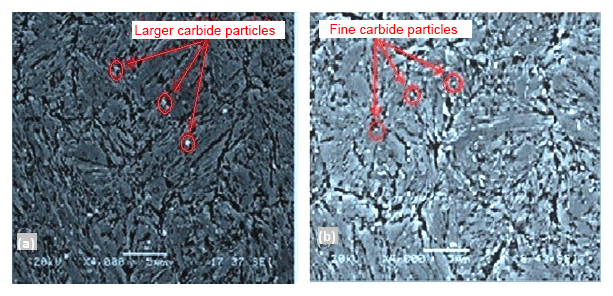
Cryogenical treatment of the electrode is performed in a cryogenic chamber, which is shown in Fig. 1. In this operation liquid nitrogen gas is used to perform the cryogenic treatment. The cryogenic treatment (CT) is a slow cooling process, with a cool-down rate of approximately 2–3 ∘C min−1 to room temperature from the temperature of liquid nitrogen (−130 ∘C min−1). After reaching the temperature of an electrode at such a limit, the material is sunk at a same temperature for approximately 1 d. After that, the electrode is removed from liquid nitrogen and goes through the heat treatment process. In this heat treatment process, electrode heats up from room temperature to above 100 ∘C and cools down at room temperature in ambient air (Gill and Singh, 2010; Dhanachezian et al., 2011; Singh et al., 2015). In this treatment, phase transformation occurs, and this transformation increases the hardness of the tool material when austenite starts converting into martensite; but during this transformation, all austenite did not convert into martensite (Kumar et al., 2012; Kalsi et al., 2010). Therefore, large and non-uniform carbides are produced with residual stress and a brittle structure, which are shown in Fig. 6a. These non-uniform carbides affect the tool life.
Therefore, to control on this problem, the tool is tempered after cryogenic treatments, which is shown in Fig. 1.
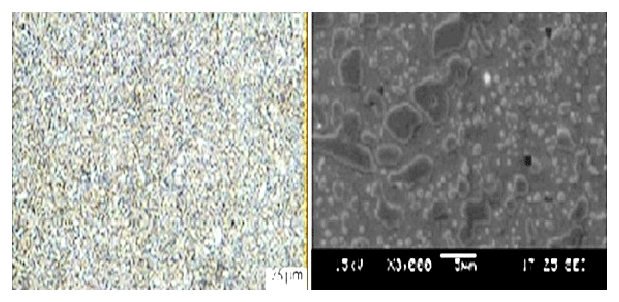
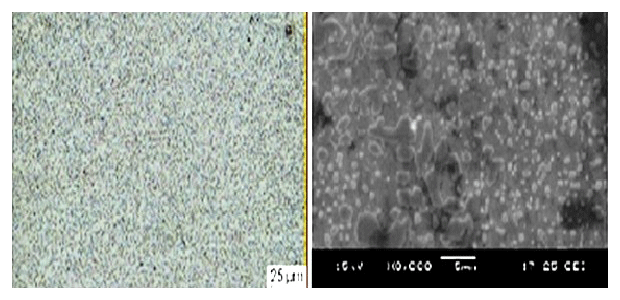
The tempering process helps in reducing the stress and brittleness. Moreover it transforms the retained austenite into martensite with the formation of a fine and uniform chromium carbide microstructure. The untreated, cryogenically treated and deep cryogenically treated with tempering (CTT) microstructure analyses are shown in Figs. 3, 4 and 5 respectively. The microstructure in CTT is more uniform, small in size and symmetrical than the cryogenically treated and the non-cryogenic electrode. In Fig. 5 microstructures are more uniform than in Figs. 3 and 4. The precipitation of the fine carbide particle structure of carbide shown in Fig. 6b is more fine and uniform than in Fig. 6a. So this fine carbide improves toughness, fatigue resistance, hardness, wear resistance, surface smoothness and dimensional stability. Therefore CTT is more significant than CT.
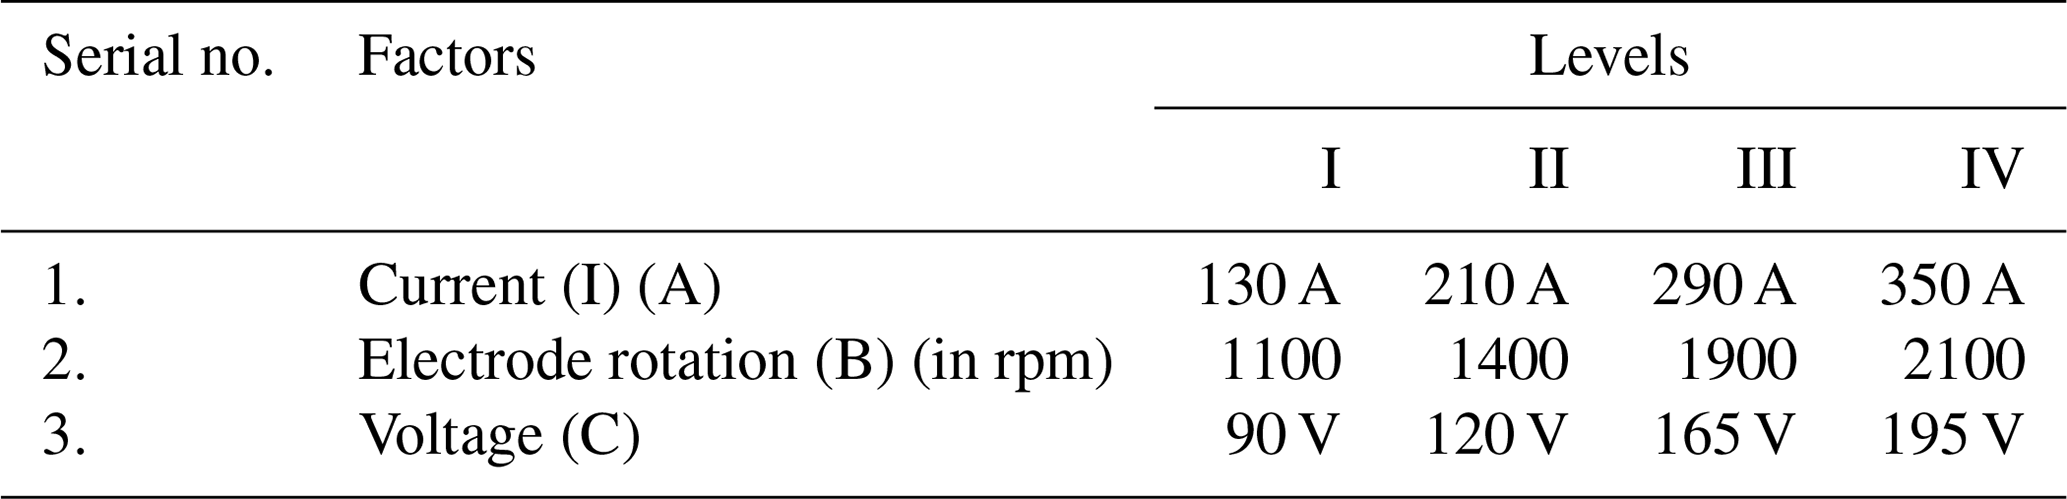
In these cases (deep cryogenically treated and untreated), the same level and parameters are used. During the operation in EDM, some material was removed from the tool and as well as from the work piece, but the material removal rate from the work piece is very high compared to the tool wear rate because the work piece is connected with positive polarity, and therefore a large amount of heat is generated on the work piece during sparking (Kumar et al., 2012; Kalsi et al., 2010). The Taguchi design is used to perform the experiment, and afterwards ANOVA is used for analysis. In this research, L16 is used for the experiment. There are three input factors (current, electrode rotation and voltage) with four levels that are given in Table 3. In the literature there is much less work done with electrode rotation with deep cryogenic treatment. There is no research in the literature with these levels that has been selected for a research paper on EN24 steel. Due to this, these levels are selected for traditional and non-traditional EDM.
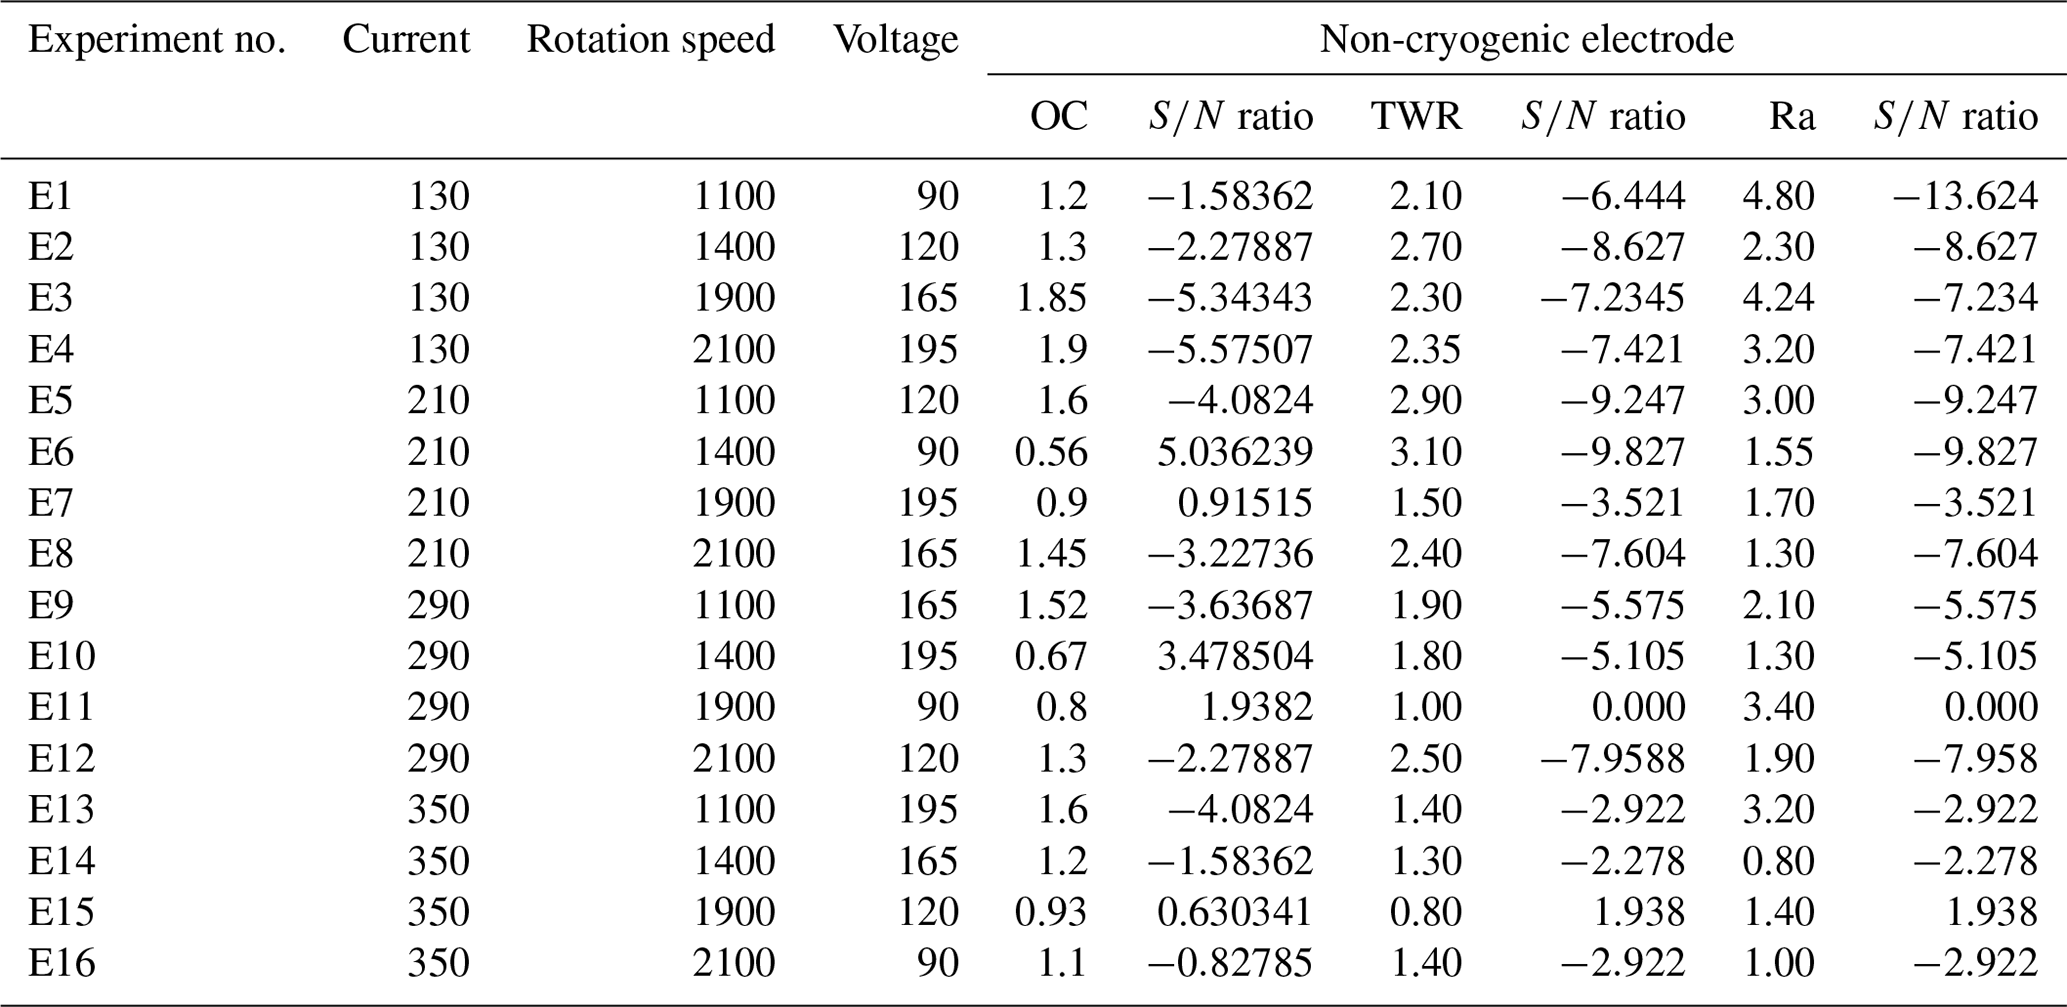
Table 4Orthogonal array with performance for simple (non-cryogenic) electrode.
2.4 Utility concept
Quality is an important factor that customers use to evaluate a product or service. So the new quality-control and improvement programmes have to make their products more acceptable to the customers. On the other hand, a customer evaluates a product performance based on a number of diverse qualitative characteristics. To improve the rational decision-making, the evaluations of various attributes should be combined to give a composite index. Such a composite index is known as the utility of a product. The sum of utilities of each quality attribute represents the overall utility of a product. It is difficult to obtain the best combination of process parameters when there are multiple responses. If xi represents the measure of effectiveness of the ith process response characteristic and n represents the number of responses, then the overall utility function can be written as
where is the weight assigned to the ith response characteristic.
2.5 Results and discussion
In EDM, the cavity is produced with the help of a spark that is generated between the electrode and work piece. Therefore the overcut is the difference between the size of the cavity on the work piece and the diametrical size of the electrode:
where Dcs is the diameter of the cavity, and De is the diameter of the electrode.
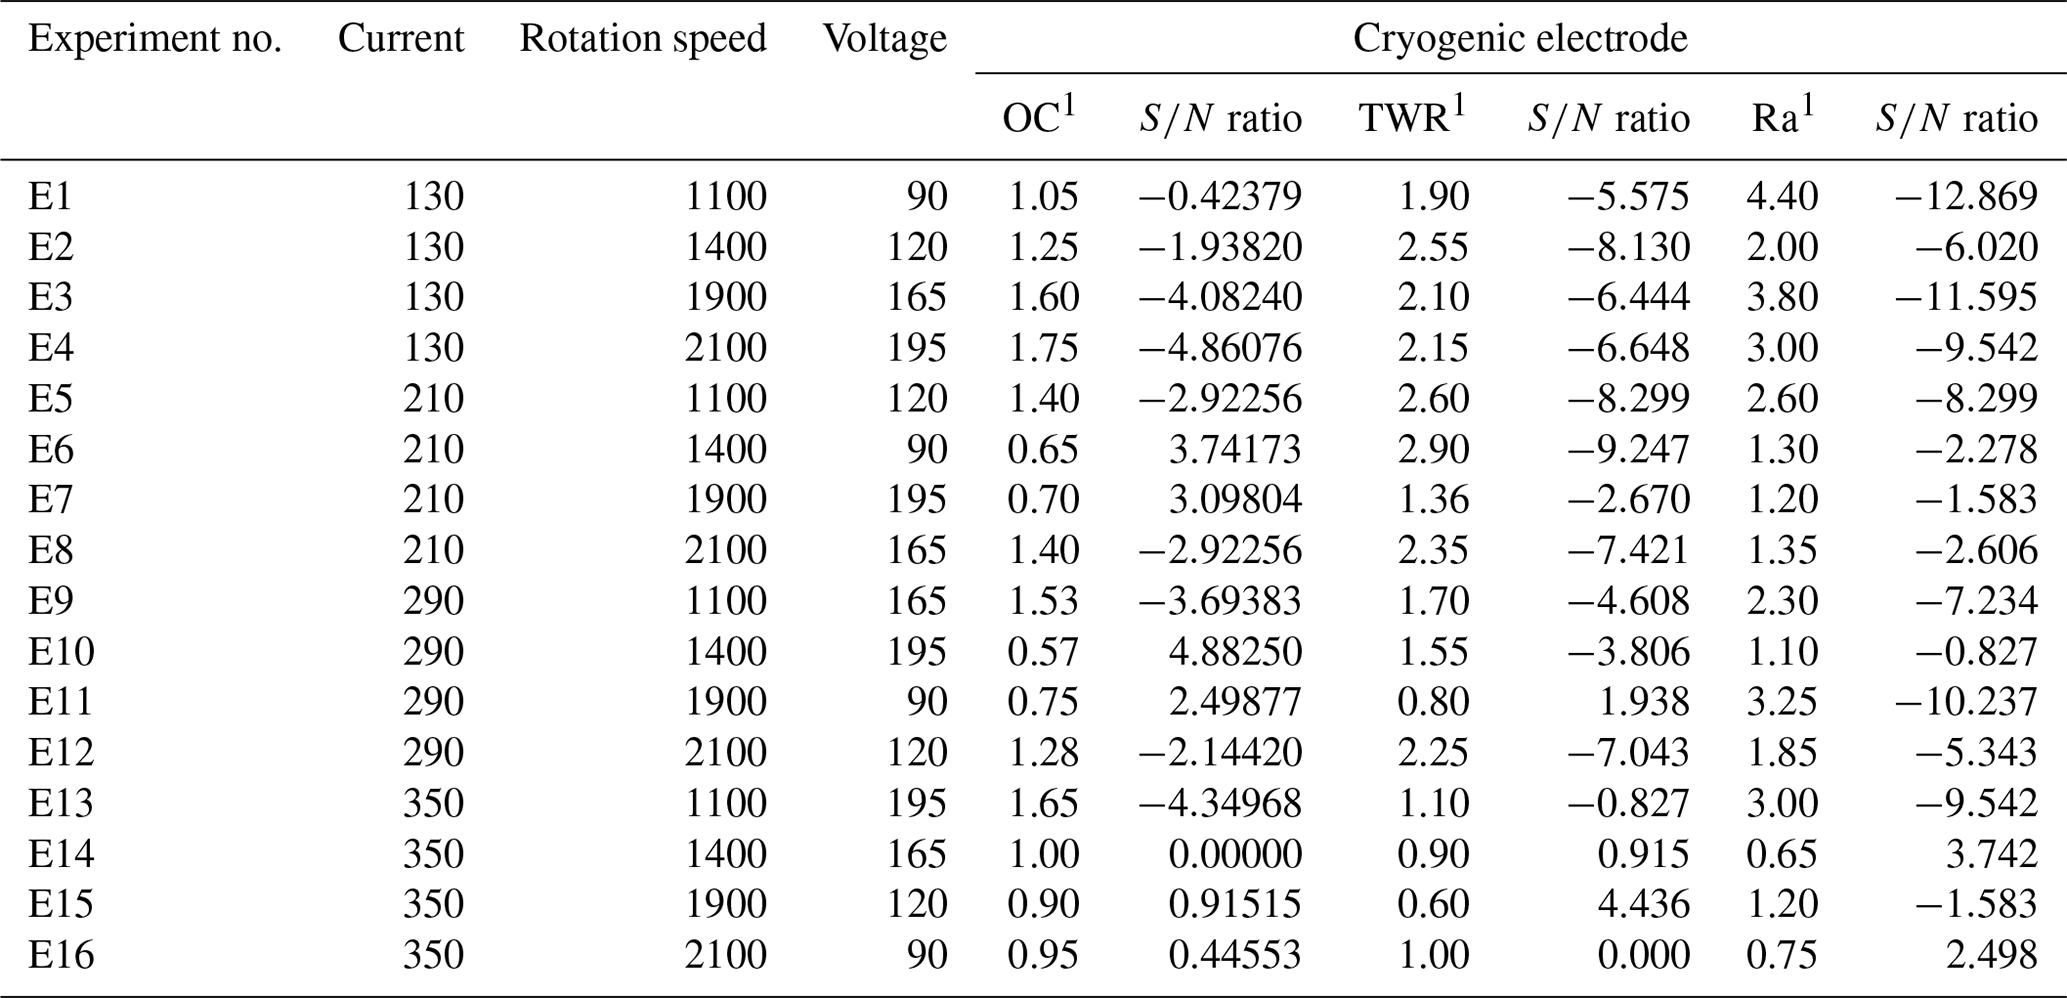
Surface roughness is measured with the help of a portable Profilometer Talysurf. Tables 4 and 5 represent the values of the overcut, tool wear rate and surface roughness for conventional EDM and the deep cryogenic electrode and cryogenically treated EDM (CCT) respectively. For the tool wear rate,
where Tw1 is the weight of the electrode before machining, tw1 is the weight of the electrode after machining, q is the density of the electrode and T is time.
Table 5Orthogonal array with performance for deep cryogenic electrode.
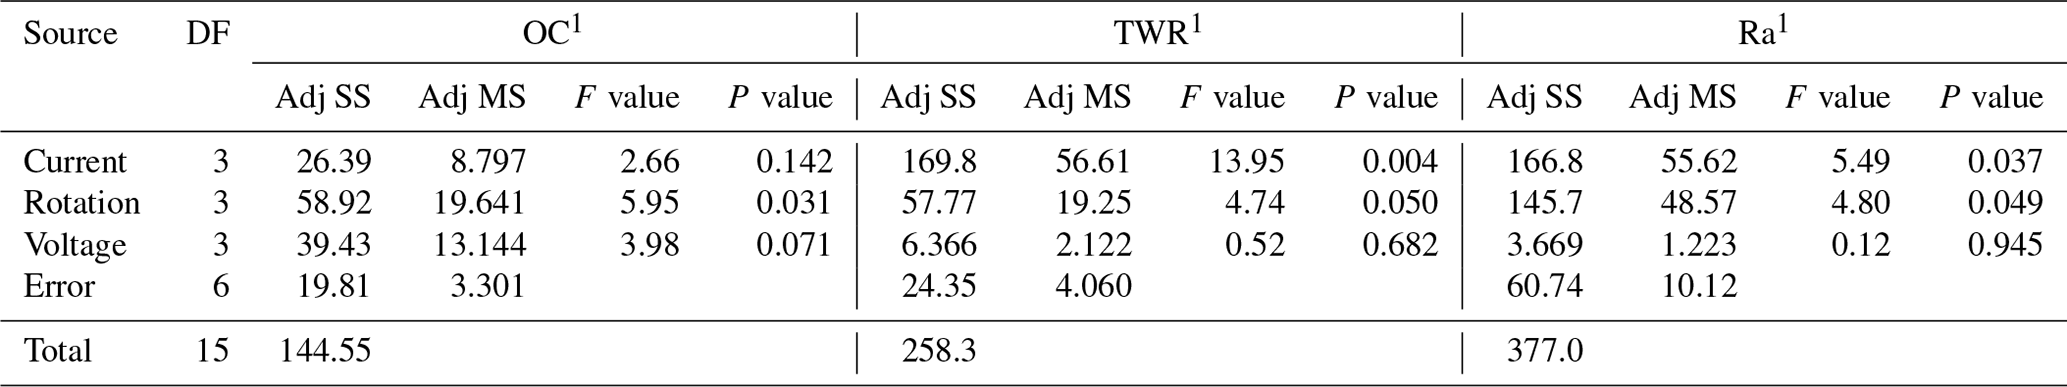
Tables 6 and 7 represent the ANOVA for the S∕N ratio for the output responses. With the help of Tables 6 and 7, significant and insignificant factors are highlighted.
Table 6Analysis of variance (ANOVA) for S∕N ratio of non-cryogenic electrode (Adj SS – adjusted sums of squares; Adj MS – adjusted mean squares).
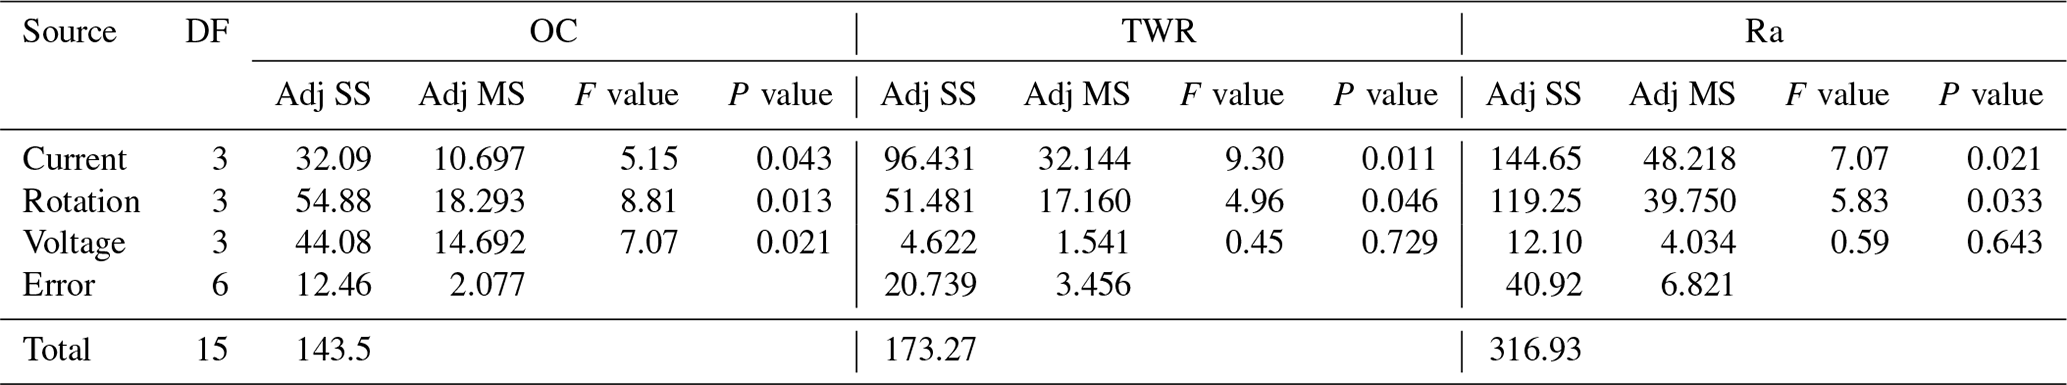
Table 7Analysis of variance (ANOVA) for S∕N ratio of cryogenic electrode.
Tables 8 and 9 represent the ranked value of an input variable like the current, rotation and voltage for an output variable or response variable for the untreated electrode and deep cryogenically treated electrode. In this table the current has a high ranked value (high impact) for the tool wear rate and surface roughness, but in the case of the overcut, the current has much less impact.
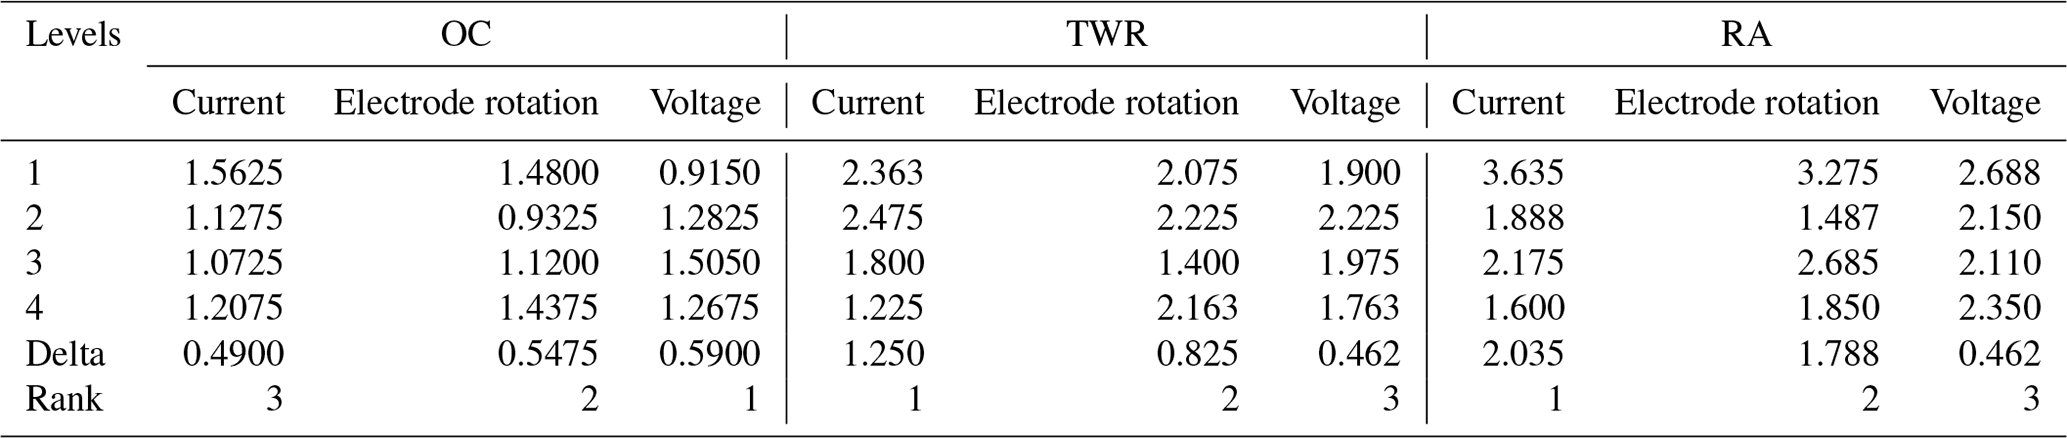
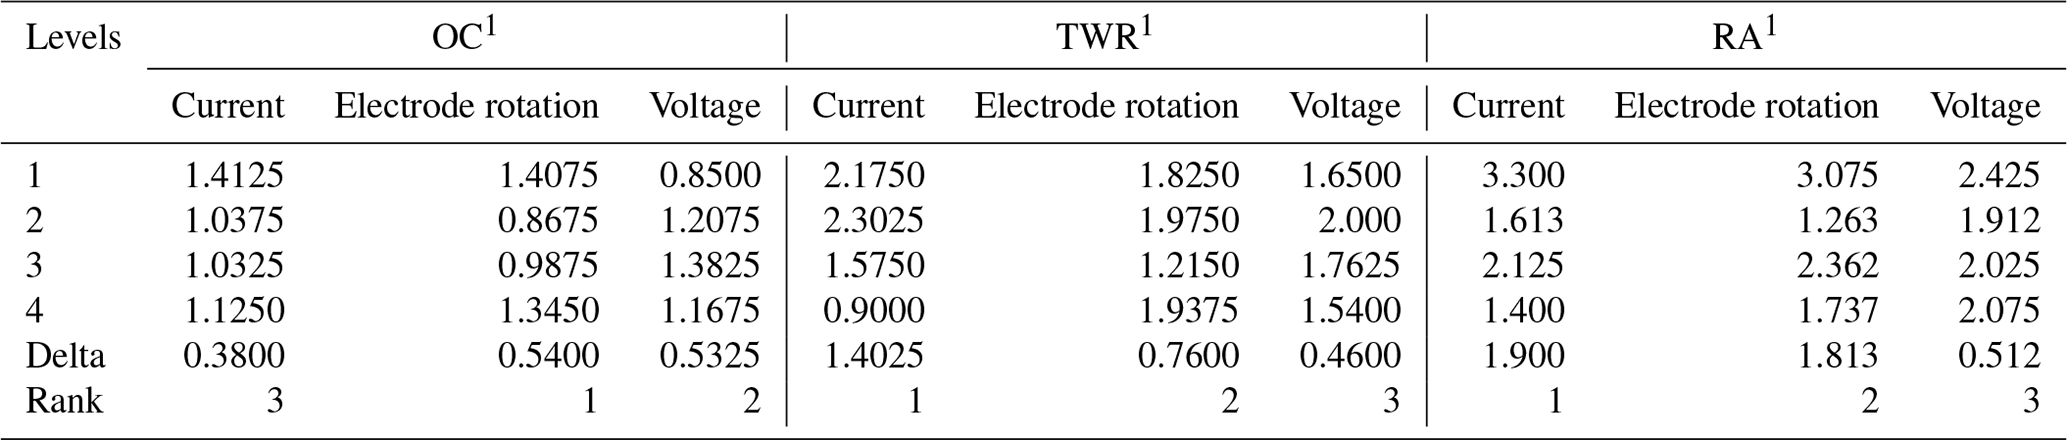
Table 9Mean response table for the deep cryogenically treated with tempering (CTT) electrode.
2.6 Analysis for cryogenically treated and non-cryogenically treated electrode
The graphs are made with the help of Minitab software. These graphs highlight the process parameters and different optimal levels for machining.
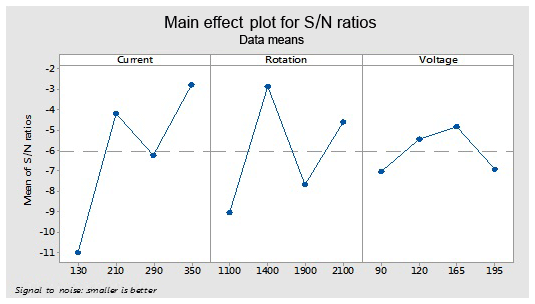
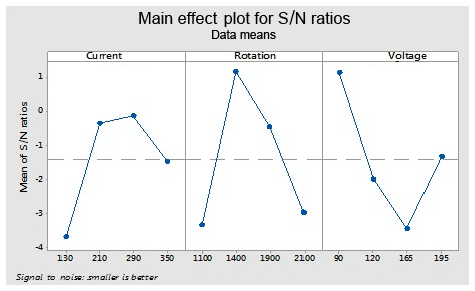
These optimal parameters are the current (130), rotation of electrode (1100) and voltage (165 V) for an ordinary electrode (non-cryogenically treated electrode). These levels give an optimal value of the overcut (rough cut) that is shown in Fig. 7.
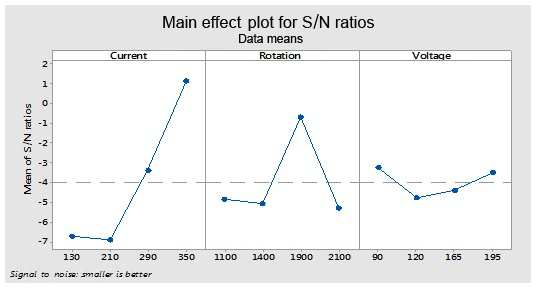
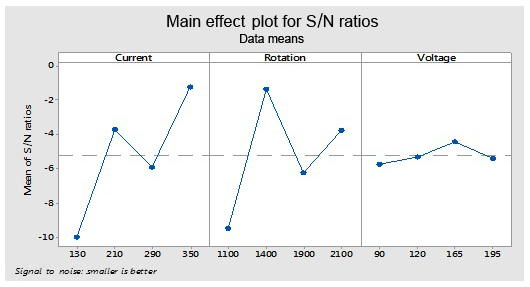
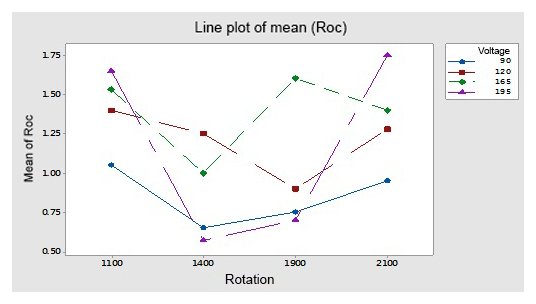
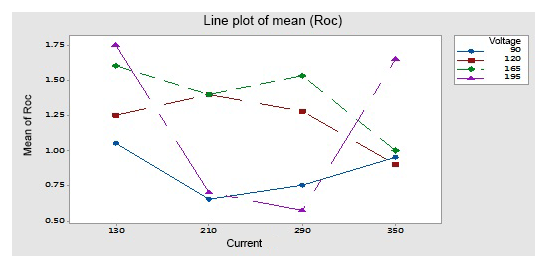
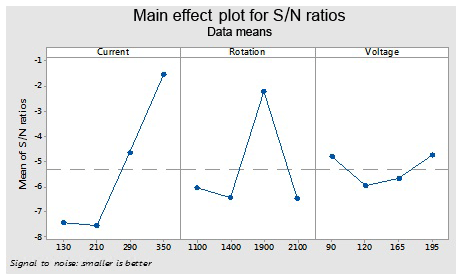
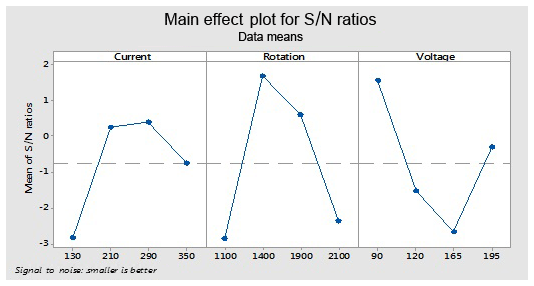
This figure helps in selecting the optimal levels (having a small value of the S∕N ratio) of different factors. Similarly same factors and levels are set up for the next experiments for the cryogenically treated electrode. The results are seen after measuring the values of the overcut, and S∕N graphs are shown in Fig. 12 after analysis. The optical parameters for a treated electrode are the same as in the previous experiment that was performed for an untreated electrode. On the other hand, first, optimal parameters are observed in the case of an untreated electrode for the TWR and Ra, and then the same levels and parameters are set up for a cryogenically treated electrode to TWR1 and Ra1. Figures 8 and 13 show the graphs of the TWR for the untreated and cryogenically treated electrode respectively, and Figs. 11 and 14 represent surface roughness. In Figs. 8 and 13 there are minimum values of the S∕N ratio that are taken as optimal levels. In the case of a current factor, 210 A has a smaller S∕N ratio. In the case of the rotation factor, 2100 rpm has a smaller S∕N ratio, and similarly to the case of voltage (210 V), it has a smaller value of S∕N. So these are the optimal levels of their respective factors, and Figs. 11 and 14 show the surface roughness graphs for the normal tool and cryogenically (deep) treated tool respectively. Figures 9, 10, 15 and 16 represent the mean overcut of deep cryogenic and normal tool with factors and their levels. These figures shed light on more significant factors, having a small value of the rough cut. In these figures, one factor (voltage) remains to be fixed, and other factors (current and voltage) change.
In this section, the optimal values of the response characteristic (overcut, tool wear rate and surface roughness) and their levels have been predicted for the untreated and deep cryogenically treated electrode.
The 95 % confidence intervals of confirmation experiments and the sample group (CICE) and confidence intervals for the entire group or population (CIPOP) are given in the following equation.
The confidence intervals of confirmation experiments are represented by
The confidence intervals of the confirmed population are calculated from
where Fα(1,fe) is the F ratio at the 95 % confidence level against DOF (degree of freedom) and the error in DOF fe, Ve is the value of error, and R is the trail number for confirmation.
3.1 Validation test for the non-cryogenically treated electrode and/or traditional EDM
After completing the above experiment, the next step is to find the significant parameters and their importance and a validation test for traditional EDM by using optimal levels.
3.1.1 OC (overcut for non-cryogenic electrode)
In the case of untreated electrode for overcut (OC), find the predicted values at the significant condition. The selected values of significant factors like current (A1), electrode rotation (B1) and voltage (C3) are shown in Fig. 7 and Table 6. The estimated mean of the response characteristic can be determined as
where TOC overall is the mean of OC in Table 4.
The confidence interval for the sample group (CICE) is at 95 % confidence, calculated from Eq. (1), where Fα(1,Fe) is the F ratio value of 5.99; Ve=2.077 (from Table 6); and and R=1, where N=16, DOF = 9 and neff=1.6.
By putting these values in Eq. (1), CICE=4.49633. The predicted range for sample size is ΔOC .
The confidence interval for the entire group (CIPOP) is at 95 % from Eq. (2).
, Ve=2.077 and neff=1.6. When putting these values into Eq. (2) above, CIPOP=2.7885. The predicted range for the entire group is .
From the CICE and CIPOP the positive validation test is shown for the non-cryogenically treated electrode. It shows that the mean values of the overcut for the sample group and for the entire population lie between the limits, and the test is then validated.
The optimal values of process variables are as follows:
-
The first level of the current is AI = 130 A.
-
The first level of the electrode rotation is BI = 1100 rpm.
-
The third level of the voltage is CIII = 165 V.
3.1.2 TWR (tool wear rate for non-cryogenic tool)
The optimal value of TWR is predicted at significant variables. The estimated mean of the response characteristic can be determined as
where TTWR is the overall mean of TWR in Table 4:
This represents the 95 % confidence interval of the confirmation experiment (CICE) and population (CIPOP) from the equations,
so CICE=5.455 and CIPOP=3.009.
The predicted range for sample size is .
The predicted range for entire group is .
The optimal values of process variables are as follows:
-
The first level of the current is AII = 210 A.
-
The first level of the electrode rotation is BIV = 2100 rpm.
-
The third level of the voltage is CII = 120 V.
3.1.3 Ra (surface roughness for non-cryogenically treated tool)
The optimal value of Ra is predicted at significant variables. The estimated mean of the response characteristic can be determined as
where TRa is the overall mean of Ra in Table 4:
This represents the 95 % confidence interval of the confirmation experiment (CICE) and population (CIPOP) from the equations,
so CICE=7.664 and CIPOP=4.228.
The predicted range for the sample size is .
The predicted range for entire group is .
The optimal values of process variables are as follows:
-
The first level of the current is AI = 130 A.
-
The first level of the electrode rotation is BI = 1100 rpm.
-
The third level of the voltage is CI = 90 V.
3.2 Validation test for cryogenically treated electrode and/or non-traditional EDM
Similarly the next step is to find the significant parameters and their importance and the validation test for non-traditional EDM by using the same optimal levels that are used in traditional EDM.
3.2.1 OC1 (overcut for deep cryogenic electrode)
In the case of OC1, find the predicted values at the significant condition. The selected values of significant factors like the current (A1), electrode rotation (B1) and voltage (C3) are shown in Fig. 12 and Table 7. The estimated mean of the response characteristic can be determined as
where is from Table 5, and
Now the confidence interval for the sample group (cCICE) is at the 95 % conformation interval for the cryogenic tool.
, Ve=3.301, R=1, N=16, DOF = 3 and neff=4. When putting these values into Eq. (1) above,
The predicted range for sample size is .
The confidence interval for entire group (CIPOP) for the cryogenic tool can be calculated as follows.
Similarly, put the values of Fα(1,Fe), Ve and neff for the cryogenically treated electrode into Eq. (2). Then CIPOP=2.223.
The predicted range for entire group is .
The equations show that the mean values lie within limits. Therefore the both tests are validated. The optimal level values of factors are the same as in the overcut of traditional EDM.
3.2.2 TWR1 (tool wear rate for cryogenic tool)
The optimal value of TWR1 is predicted at significant variables. The estimated mean of the response characteristic can be determined as
where is the overall mean of TWR1 in Table 5:
This represents the 95 % confidence interval of the confirmation experiment (CICE) and population (CIPOP) from the following equations, so CICE=5.9128 and CIPOP=3.2623.
The predicted range for sample size is .
The predicted range for entire group is .
3.2.3 Ra1 (surface roughness for cryogenically treated tool)
The optimal value of Ra1 is predicted at significant variables. The estimated mean of the response characteristic can be determined as
where is the overall mean of Ra1 in Table 5:
This represents the 95 % confidence interval of the confirmation experiment (CICE) and population (CIPOP) from the equations.
So CICE=9.3352 and CIPOP=5.150.
The predicted range for sample size is .
The predicted range for entire group is .
From this, CICE and CIPOP lie between the limits, and the test is validated.
3.3 Regression equation
3.3.1 The regression equation for untreated electrode
-
For the overcut (OC), it is 1.112 − 0.00160. The current is + 0.000006, and the rotation speed is + 0.00360 V.
-
For the tool wear rate (TWR), it is 4.031 − 0.00541. The current is − 0.000283, and the rotation is − 0.00197 V.
-
For surface roughness (Ra), it is 5.75 − 0.00814. The current is − 0.000658, and the rotation is − 0.00245 V.
3.3.2 The regression equation for cryogenically treated electrode
-
For overcut (OC1), it is 1.068 − 0.00124. The current is − 0.000038, and the rotation speed is + 0.00316 V.
-
For the tool wear rate (TWR1), it is 3.837 − 0.00601. The current is − 0.000236, and the rotation is − 0.00170 V.
-
For surface roughness (Ra1), it is 5.27 − 0.00703. The current is − 0.000675, and the rotation is − 0.00243 V.
3.4 Conformation test
To evaluate the adequacy of the proposed approach and statistical analysis, a set of verifications is conducted on predicted values. The confirmation test is carried out to check the reproducibility of predicted results. The predicted results came from Eqs. (9) to (14).
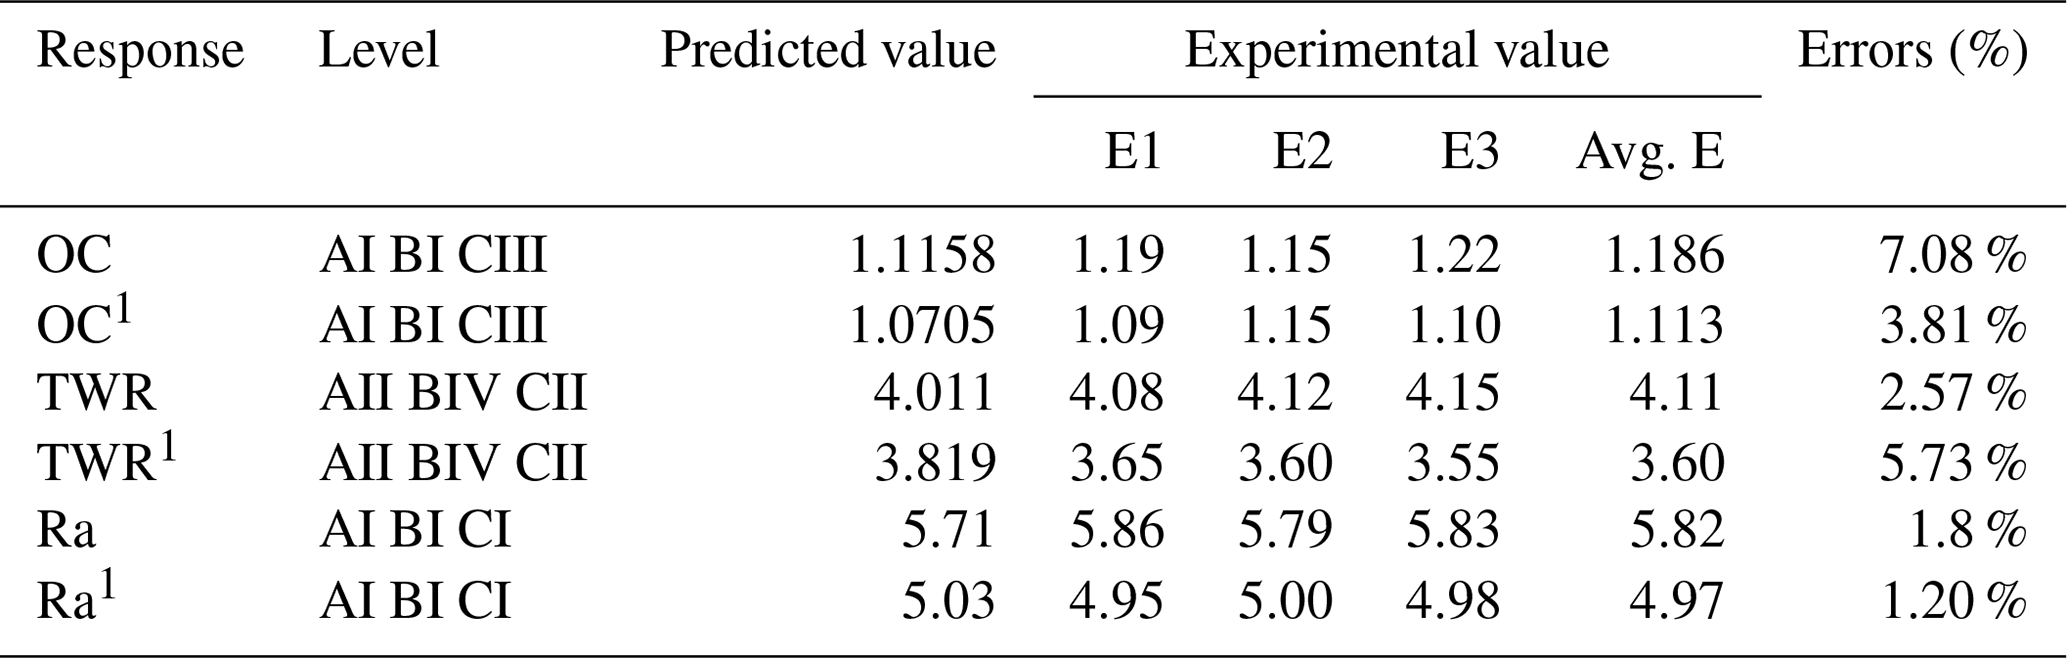
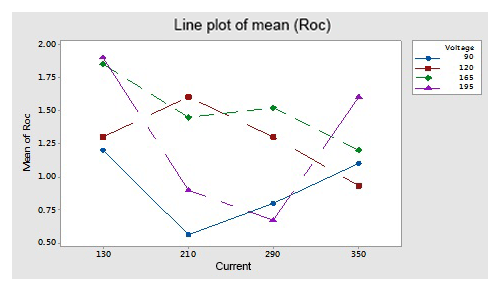
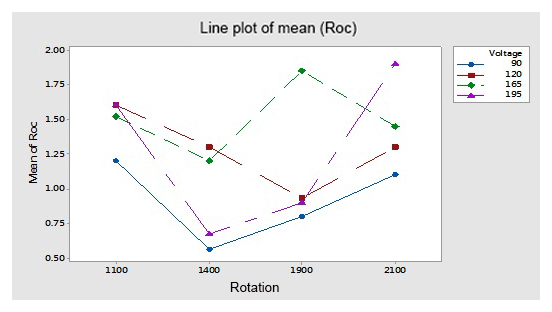
By using optimal parameters in the above equation, predicted OC and OC1 are found; moreover the three (E1, E2 and E3) sets of experiments are performed on the optimal levels (A1, B1 and C3) of parameters to find the experimental value of OC and OC1. Plots of the S∕N ratio in Figs. 7 and 12 for untreated and cryogenically treated electrode respectively show the optimal levels for different factors. The line plots of the mean Roc (Roc – rough cut) show the predicted value of the treated (OC1) and untreated (OC) electrode. Figures 11 and 12 show the mean value of the overcut on the left-hand side; the bottom side shows the value of different factors, and the right-hand side shows the largest rank factor values. In this, both figures' current (130 V), rotation speed (1100) and voltage (165 V) have a mean value of the overcut or rough cut of 1.50 by combining two factors. Similarly, Figs. 8, 11, 13 and 14, for the untreated and treated electrode, show the predicted values of TWR and Ra, respectively. Figures 7 to 16 and Table 10 confirm and validate the experimental result mathematically. In this Table 10 takes optimal values of factors, and the experiment for the untreated and deep cryogenically treated electrode is performed again. Therefore from the above experiment, it can be seen that this experiment is valid and that the positive responses were confirmed for non-traditional EDM rather than traditional EDM.
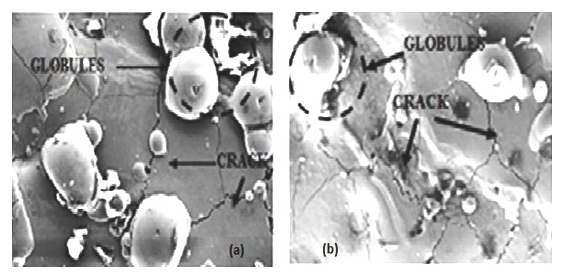
Figure 17a and b show SEM images of the work piece surface by using the surface roughness optimal values (AI, BI and CI) of factors for both traditional and non-traditional EDM respectively. The significant variables labels are a current of 130 A, an electrode rotation of 1100 rpm (rpm – rotations per minute) and voltage of 90 V. Based on the recast layer, globules and cracks are observed. The cracks are formed due to thermal stress that is generated during machining. The Fig. 17a notation image shows the work piece surface that is used for the untreated electrode, and Fig. 17b shows the work piece surface that is used for the deep cryogenically treated electrode.
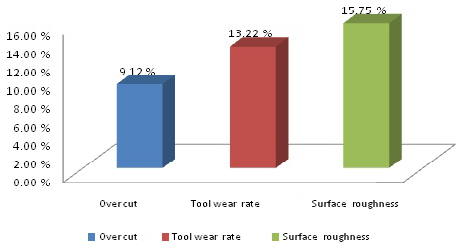
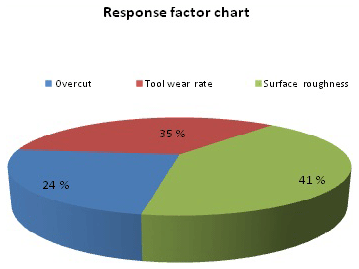
Figure 17 shows that the globule size and crack size are smaller in non-traditional than traditional or conventional EDM. Sizes of globules and cracks affect the surface roughness. If the size of globules and cracks is smaller, then the surface roughness is also smaller. So the cryogenically treated electrode has a more significant resultant than the untreated electrode (conventional EDM). Figure 18 and Table 10 show the percentage difference between the traditional and non-traditional EDM. The experiment performed by taking the same levels for the untreated and cryogenically treated electrode found that the overcut, tool wear rate and surface roughness were reduced by 9.12 %, 13.22 % and 15.75 % respectively in non-traditional EDM compared to conventional EDM. Figure 19 shows which response factor is more affected if the experiment is conducted with the deep cryogenically treated electrode. The percentages affecting the response factors are 24 %, 35 % and 41 % for the overcut, tool wear rate and surface roughness respectively. From the experiment that is represented in the form of a chart in Figs. 18 and 19, surface roughness is found to have reduced more than the other response factors. The percentage difference that can be calculated is given below:
Other researchers have conducted an experiment on the cryogenic treatment for different response factors with their evidence. Dhanachezian et al. (2011) performed an experiment on cryogenic treatment with liquid nitrogen as a cooling medium and found a reduction in the tool wear rate and surface roughness compared to the conventional process. Huang et al. (2003) performed an experiment on the cryogenic treatment for the M2-tool steel and concluded that wear resistance improves due to the formation of the carbon cluster on the surface of the electrode after cryogenic treatment. Collins and Jarmer (1997) presented the results of cryogenic treatment and suggested a 29 % to 54 % improvement in the case of MRR and a 0.7 % to 4 % reduction in the case of surface roughness compared to the non-cryogenic treatment. Srivastava and Panday (2012) investigated an experiment on the M2-grade high-speed steel work piece and found a 20 % reduction in the tool wear rate by cryogenic cooling of the electrode. S. Kumar et al. (2014) found that the deep cryogenic treatment of Titanium alloys increases the material removal rate while increasing the thermal and electrical conductivity. Goyal et al. (2018) performed an experiment on the AISI D2-tool steel with a copper electrode and found that the material removal rate increased by approximately 18 % and surface roughness reduced by 11 % approximately with the cryogenic tool. Abdulkareem et al. (2010) investigated the effect of electrode cooling on electrode wear. They calculated that 14 % to 20 % of electrode wear can be reduced by using optimal values of input parameters for cryogenic EDM.
3.5 Significance of non-traditional EDM
Tool life is longer and no special tooling is required, so the tool cost decreases. Non-traditional EDM eliminates secondary finishing operations because the surface roughness is less than traditional EDM. A thin wall can be machined due to a smaller overcut in the deep cryogenically treated electrode than in a normal electrode. Surface finish of product is good, and wastage of raw material is less in the deep cryogenic treatment than in traditional EDM.
The present experimental work is concerned with determining the optimum setting of EDM to find the optimal overcut, TWR and Ra. L16 was used for performing the experiment.
The voltage and electrode rotation have the maximum effect on the radial overcut (OC), also known as ROC, compared to the pulse current in the case of a non-cryogenic electrode. In the case of surface roughness for an untreated electrode, the pulse current has a higher ranked effect than rotation and voltage. Like in the tool wear rate, the pulse current has dominating effects.
Optimum parameters (for both cases) of the overcut are as follows: a current of 130 A, a rotation speed of 1100 rpm and a voltage of 165 V. The best fits for the tool wear rate are a current of 210 A, an electrode rotation speed of 2100 rpm, and a voltage of 120 V. In cases of surface roughness, 130 A, 1100 rpm and 90 V are the best levels with respect to the current, rotation speed and voltage.
The pulse current and rotational speed are the most significant factors for the tool wear rate and surface roughness in the case of the deep cryogenically treated electrode, but in the case of the deep cryogenically treated electrode, for the overcut, only electrode rotational speed has a larger effect.
The validation and confirmation test confirmed that the adequacy of a law of additively is justified. The deep cryogenically treated electrode has a smaller value of the overcut than the non-cryogenically electrode. So the deep cryogenically treated electrode (non-traditional) has larger effects on the response factors than the traditional electrode; 9.12 % less overcut was found in this experiment. In other words, approximately 9 % less overcut was produced in the cryogenically tempering-treated tool compared to the non-cryogenically treated tool. In the case of the tool wear rate, the wear rate is reduced by 13.22 % with cryogenic treatment. On the other hand, it was observed in the experiment that the surface roughness was reduced by 15.75 % (approximately 15 % to 16 %) by using the deep cryogenically treated electrode instead of the untreated electrode. So in the end, it is found that machining has positive results after the cryogenic tempering treatment of the electrode.
Deep cryogenic treatment improves the thermal conductivity of the tool and reshapes carbide into a uniform and homogenous structure more frequently than the non-cryogenic tool. Due to this, the power consumption and wear losses are reduced. Therefore, the deep cryogenic tool is used as a priority base more than the non-cryogenic tool where a high-speed-cutting operation was performed.
The deep cryogenic treatment improves tool life, so it reduces investment for the purchase of new cutting tool; moreover less wear and tear decreased the reshaping and regrinding of a tool, so it reduced the labour cost and ideal time of machining to replace the tool. The deep cryogenically treated electrode improves the quality and production rate more than the non-cryogenic electrode.
The experiment between the deep cryogenic and untreated electrode represented non-traditional EDM being more effective and efficient than the traditional EDM process.
Data used in this article are available upon request.
| EDM | Electric discharge machining |
| OC | Overcut for non-cryogenic electrode |
| OC1 | Overcut for deep cryogenic electrode |
| TWR | Tool wear rate for non-cryogenic tool |
| TWR1 | Tool wear rate for deep cryogenically treated tool |
| Ra | Surface roughness for non-cryogenically treated tool |
| Ra1 | Surface roughness for deep cryogenically treated electrode |
| d | Days |
GSG and DPD were responsible for problem finding, conceiving and designing the analysis, collecting the data, contributing data or analysis tools, conducting the experiment and receiving a fruitful result, performing the analysis, and writing the paper.
The authors declare that they have no conflict of interest.
Gurdev Singh Grewal would like to express his deep gratitude to his father S. Sukhdev Singh Grewal for guidance and financial support.
This paper was edited by Xichun Luo and reviewed by Senthil Kumaran Selvaraj and one anonymous referee.
Abdulkareem, S., Khan, A. A., and Koneeh, M.: Reducing electrode wear ratio using cryogenic cooling during electrical discharge machining, Int. J. Advanced Manuf. Tech., 45, 1146–1151, https://doi.org/10.1007/s00170-009-2060-5, 2009.
Abdulkareem, S., Khan, A. A., and Konneh, M.: Cooling Effect on Electrode and Process Parameters in EDM, Mater. Manuf. Process., 25, 462–466, https://doi.org/10.1080/15394450902996619, 2010.
Collins, D. N. and Jormer, J.: Deep cryogenic treatment of a D2 cold work tool steel, Heat Treat. Met.-UK, 3, 71–74, 1997.
Dhananchezian, M., M, P. K., and Sornakumar, T.: Cryogenic turning of AISI 304 stainless steel with modified cutting tungsten carbide tool insert, Mater. Manuf. Process., 26, 781–785, 2011.
Gill, S. S. and Singh, J.: Effect of Deep Cryogenic Treated on mach inability of Titanium Alloy (Ti-6246) in Electric Discharge Drilling, Mater. Manuf. Process., 25, 378–385, 2010.
Goyal, R., Singh, S., and Kumar, H.: Performance evaluation of cryogenically assisted electric discharge machining (CEDM) process, Mater. Manuf. Process., 33, 433–443, https://doi.org/10.1080/10426914.2017.1317789, 2018.
Habib, C. and Sameh, S.: Study of the parameters in electrical discharge machining through response surface methodology approach, Appl. Math. Model., 33, 4397–4407, 2009.
Huang, J. Y., Zhu, Y. T., Liao, X. Z., Berlein, I. J., Bourke, M. A., and Mitchell, T. E.: Microstructure of cryogenic treated M2 tool steel, Mater. Sci. Eng., 339, 241–244, 2003.
Kalsi, S. N., Sehgal, R., and Sharma, S. V.: Cryogenic Treatment of Tool Materials: A Review, Mater. Manuf. Process., 25, 1077–1100, https://doi.org/10.1080/10426911003720862, 2010.
Kapoor, J., Singh, S., and Khamba, J. S.: Effect of cryogenic treated brass wire electrode on material removal rate in wire electrical discharge machining, P. I. Mech. Eng. C-J. Mech., 226, 2750–2758, 2012.
Kumar, A., Maheshwari, S., Sharma, C., and Beri, N.: Machining Efficiency Evaluation of Cryogenically Treated Copper Electrode in Additive Mixed EDM, Mater. Manuf. Process., 27, 1051–1058, https://doi.org/10.1080/10426914.2011.654151, 2012.
Kumar, B. R., Routara, B. C., Parida, A. K., and Sahoo, A. K.: Parametric Optimization Of Al-Sic12% Metal Matrix Composite Machining By Electrical Discharge Machine, 5th Int. & 26th All India Manuf. Tech, Design & Res. Conference (AIMTDR 2014), IIT guwahti, 12–14 December 2014, Assam, India, 345–345, 2014.
Kumar, S., Batish, A., Singh, R., and Singh, T.: A mathematical model to predict material removal rate during electric discharge machining of cryogenically treated titanium alloys, P. I. Mech. Eng. B-J. Eng., 229, 214–228, 2014.
Kumar, V. and M, P. K.: Optimization of cryogenic cooled EDM process parameters using grey relation analysis, J. Mech. Sci. Technol., 28, 3777–3784, 2014.
Kumar, V. and M, P. M.: Machining process parameter and surface integrity in conventional EDM and cryogenic EDM of Al–SiCp MMC, J. Manuf. Process., 20, 70–78, https://doi.org/10.1016/j.jmapro.2015.07.007, 2015.
Shazarel, S., Mohamed, S., and Yusof, M.: Electrical Discharge Machining (EDM) Of Beryllium Copper Alloys Using Design of Experiment (Doe) Approach, Int. Eng. Convention, Damascus Syria, 11, 257–268, 2009.
Singh, P. B., Phull, G. S., and Puggal, S.: Study of radial overcut during EDM of H-13 steel with cryogenic electrode using Taguchi method, Int. J. Mechanical Eng. & Robotics Research 4, 33–40, 2015.
Singh, R. and Singh, B.: Comparison of Cryo treatment effect on Machining characteristics of Titanium in Electric Discharge machining, Int. J. Automotive and Mechanical Eng., 3, 239–248, 2011.
Srivastava, V. and Pandey, P. M.: Performance Evaluation of Electrical Discharge Machining (EDM) Process Using Cryogenically Cooled Electrode, Mater. Manuf. Process., 27, 683–688, https://doi.org/10.1080/10426914.2011.602790, 2011.
Srivastava, V. and Pandey, P. M.: Performance evaluation of EDM processing using cryogenically cooled electrode, Mater. Manuf. Process., 27, 683–688, 2012.
Srivastava, V. and Pandey, P. M.: Experimental investigation on EDM process with ultrasonic assisted cryogenically cooled electrode, J. Eng. Manuf., 227, 301–314, 2013.
Yildiz, Y. and Nalbant, M.: A review of cryogenic cooling in machining process, Int. J. Mech. Tools & Manuf., 48, 947–964, https://doi.org/10.1016/j.ijmachtools.2008.01.008, 2008.
Zhiguang, H., Zhidong, L., Zhongli, Cand Mingbo, Q.: Effect of Cryogenic Cooling of Tool Electrode on Machining Titanium Alloy (Ti–6Al–4V) during EDM, Mater. Manuf. Process., 31, 475–482, https://doi.org/10.1080/10426914.2015.1037893, 2015.